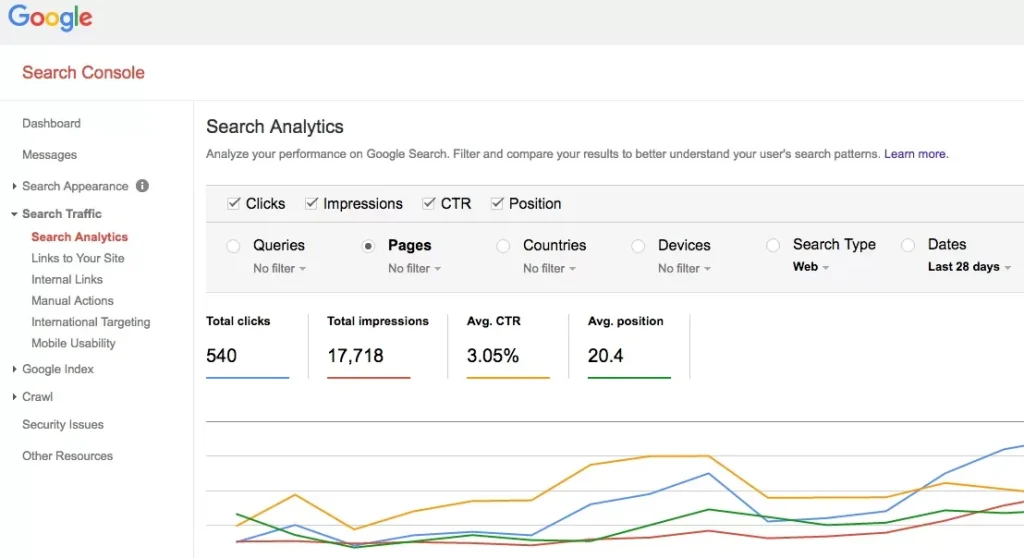
The Expected Click-Through Rate (CTR) represents the likelihood that a user will click on your ads through the keywords you have chosen. Google Ads calculates the expected click-through rate (CTR) based on factors such as device type, search terms, and other auction conditions.

"Average" or "Above Average"
If all values in Google Ads appear as “average” or “above average,” it means there are no click-through rate issues with that keyword. In summary, if your Expected Click-Through Rate (CTR) is marked as “average” or “above average” compared to other keywords on Google, it indicates that there are no significant issues with the CTR and that you are performing better than your competitors with that keyword.
Below Average
If the values for your keyword appear as “below average,” it means that you might need to adjust your Google Ads keywords to be more specific. Additionally, one of the first steps is to adjust your ad texts to align with your best-performing keywords.
When ad texts have a “below average” value, it might be wise to adjust keywords or use more relevant keywords in the ads.
For example, if you are a sock seller and users are searching for “striped socks,” Your ad group can easily include the following keywords; striped socks, colorful striped socks, decorative socks, fashion socks, colorful socks, etc. they can be as follows.
An example of below-average advertising.
Ali’s Sock Factory
Visit Our Site Today to Discover a Wide Variety of Socks. Grab a 50% discount!
Visit Our Site Today to Discover a Wide Variety of Socks. Grab a 50% discount!
People are unlikely to click on an ad that does not contain any of the relevant keywords. For a better ad, the following headline could be used as an example:
Ali’s Sock Factory – Stylish Decorative Socks Online
Visit our site today to find striped socks. Find out more!
Explore Ali’s Sock Factory for Colorful Socks today. Grab a 50% discount!
Visit our site today to find striped socks. Find out more!
Explore Ali’s Sock Factory for Colorful Socks today. Grab a 50% discount!
“Above Average”
To improve the Expected Click-Through Rate (CTR) and ensure it is above average, you can add multiple keywords to your preferred ads, remove keywords that users are not actually searching for, and include a wider variety of keywords in your ad groups.
Previously, Google categorized data based on Quality Score, click-through rate, ad relevance, and landing page experience, indicating whether the target keyword was below or above average. However, this was considered insufficient for advertisers, so Google updated the Quality Score Report to provide a comprehensive view of your keywords’ current scores. This allows advertisers to now easily and quickly access Quality Score information rather than just targeting details.
In the latest version, Google Ads has introduced three optional status columns under the Keywords tab for Expected Click-Through Rate, Ad Relevance, and Landing Page Experience.
With this data, it will be easy and practical to understand how your quality score changes over time. With the updated reporting format, Google provides a comprehensive report on how your PPC ad and landing page optimization affect everything from Quality Score to conversion rates from CPC to CTR.
Conclusion
When using Google’s latest quality score reporting, there are 3 important things to keep in mind. By keeping these three points in mind, you can optimize your Expected Click-Through Rate (CTR) values!
- You will be able to get your last known quality score for your selected date range.
- Historical data on quality score, expected click-through rate, ad relevance and landing page experience does not include data prior to January 22, 2016.
- At the end of each day, make sure to apply the “Day” metric to your keyword reports to reflect the daily values of your Quality Score.

